Wednesday, September 2, 2009

How GDB helped me fix a Drizzle Bug


The other day I found a nice surprise on my inbox. Jay Pipes asked me if I'd like to try fixing a small bug on Drizzle. It looked pretty simple, and the bug report included a big part of the fix. I accepted without a doubt.

I decided to first change trans_prealloc_size from uint32_t to uint64_t. That was done on drizzled/session.h.
Then, I went to drizzle/set_var.cc and changed sys_trans_prealloc_size from sys_var_session_uint32_t to sys_var_session_uint64_t (and removed the two extra parameters).

At first, that looked like it was everything I needed to do. I compiled drizzle, executed the queries that were included on the bug report, and that almost worked!

set session transaction_prealloc_size=1024*1024*1024*4;
set session transaction_prealloc_size=1024*1024*1024*5;
and
set session transaction_prealloc_size=1024*1024*1024*6; were all being truncated to "4294966272"

The pending problem was that I no longer received a warning telling me that those values had been truncated.

I looked again at the code, used gdb to step through the code, but I just couldn't tell what the problem was.
I was then forced to do what I do when I'm stuck on a computer problem, I had to take a break :).

... And that was a great idea, because while away from the computer, I thought of looking at sys_var_session_uint64_t::update, and compare it to sys_var_session_uint32_t::update.

It turned out that sys_var_session_uint64_t::update was missing a call to throw_bounds_warning(), no wonder I wasn't getting the truncation warnings.

It was time to enable the test suite that targeted this bug, run this particular test, commit, push .... and I suddenly thought that I should also run the regular tests, you know, make test. And I was glad I did. There were about 7 test cases that failed.

The firs thought was that these changes I just made uncovered some mysterious bugs on Drizzle. But after looking closely at the test cases, I noticed that there was something else going on.

If I executed this query: set group_concat_max_len = 4;, the session variable group_concat_max_len ended up with a value of 4294967295.

It was time for some serious GDB'ing. There are a few articles here, here and here that explain how to use gdb and Drizzle, but I start it a little different.

Starting GDB and Drizzle

On the terminal, I run:
[wizard]$ gdb --args /Applications/drizzle/sbin/drizzled --port=3306 --basedir=/Applications/drizzle --datadir=/Applications/drizzle/var

After a few seconds, I am at the (gdb) prompt. This is the time to set breakpoints, which would help me find this little issue.
I tried doing this:
(gdb)break drizzled/set_var.cc:744
but gdb told me: "No source file named drizzled/set_var.cc", I had this same problem trying to use gdb on the MySQL Proxy, and after trying different things, I found the correct way to specify the file name:
(gdb)break set_var.cc:744

*Note: when debugging plugins, you specify the filenames like this:
(gdb)break plugin/logging_gearman/logging_gearman.cc:150

(include the plugin folder)

That one breakpoint was all I needed, I then started drizzle by typing:
(gdb)run
After pressing enter, you see many lines, but the last few are (similar to)

. done
InnoDB: The InnoDB memory heap is disabled
InnoDB: Mutexes and rw_locks use GCC atomic builtins.
090827 23:45:16 InnoDB: highest supported file format is Barracuda.
090827 23:45:16 InnoDB Plugin 1.0.3 started; log sequence number 46439
Listening on :::3306
Listening on 0.0.0.0:3306
/Applications/mysql/enterprise/drizzle/sbin/drizzled: ready for connections.
Version: '2009.08.1124' Source distribution (bug-fixes)

Drizzle was ready for my tests. I went to a new terminal and executed

set group_concat_max_len = 4;
The drizzle prompt hanged there (waiting on the breakpoint I set earlier)

This is the code near the breakpoint

bool sys_var_session_uint64_t::update(Session *session, set_var *var)
{
uint64_t tmp= var->save_result.uint64_t_value;

if (tmp > max_system_variables.*offset) // <-- this was line 744
  throw_bounds_warning(session, true, true, getName(), (int64_t) tmp);
  tmp= max_system_variables.*offset;
if (option_limits)
  tmp= fix_unsigned(session, tmp, option_limits);
if (var->type == OPT_GLOBAL)
{
/* Lock is needed to make things safe on 32 bit systems */
pthread_mutex_lock(&LOCK_global_system_variables);
global_system_variables.*offset= (uint64_t) tmp;
pthread_mutex_unlock(&LOCK_global_system_variables);
}
else
session->variables.*offset= (uint64_t) tmp;
return 0;
}


Back on the GDB terminal, I saw:

Breakpoint 1, sys_var_session_uint64_t::update (this=0x4dec60, session=0x1044e00, var=0x10470c8) at set_var.cc:744
744 if (tmp > max_system_variables.*offset)

It was time to look at the value of tmp, so I typed
(gdb) print tmp
$4 = 4

So far, so good, I wanted to see 4 as the result, let's step through the code, and see when tmp gets a much higher value.
(gdb) step
746 tmp= max_system_variables.*offset;

Check the value of tmp


(gdb) print tmp
$5 = 4
(gdb) step
748 if (option_limits)
(gdb) print tmp
$6 = 4294967295

There it was, whatever happened between line 746 and 748 is causing the problem. By now you may have already spotted the issue, but I just didn't see it. I stared at that piece of code for about a minute, and then I realized what the problem was.
The if statement on line 744 was a single line statement, before I added the call to throw_bounds_warning(). Because I am so used to having brackets, even for single line if statement, I forgot to add a pair of {}.

*Note: For completeness, once you are done stepping through the code, you can type
(gdb)cont
and the program will continue to run as normal. On my case, I could then run on the drizzle terminal:


drizzle> show variables like "group_concat_max_len";
+----------------------+------------+
| Variable_name | Value |
+----------------------+------------+
| group_concat_max_len | 4294967295 |
+----------------------+------------+
1 row in set (0.01 sec)


Conclusion.
If you don't have another pair of eyes to look over your code, you could ask gdb for some help :)

Friday, August 28, 2009

Drizzle and the Gearman logging plug-in

Disclaimer:
This blog post is about things I did on my own free time, not endorsed by my employer.

I have been meaning to look at Gearman for a long time, but I just couldn't find any project where I could use it.

Well, that was true until last week a couple of weeks ago, when I started to put together Drizzle, the Gearman logging plug-in, Perl and the Enterprise Monitor.

As I was finishing writing the agent.pl script, I thought that it would be a good idea to split the script in at least two components: one that would just collect the queries, and another component that would do the processing of the log entries (replacing the literals for "?", grouping queries by query text, etc).

It was right there when I realized that this was my chance to look at Gearman! The first thought was to still use the regular query logging plug-in.
But there is already a Gearman logging plugin, and I was curious about how that worked.

A quick Google search returned very little information, but I did find the doxygen docs, and reading the code was fairly straight forward.

By reading the code, I found out that the plug-in registers the function drizzlelog with the Gearman Job server, and that it passes the same string that the query logging plug-in sends to the log file.

Next step was to find a hello world Perl + Gearman example. And I found a sample for the client and the worker. That almost worked out of the box, but I got this error:

Can't call method "syswrite" on an undefined value at /Library/Perl/5.8.8/Gearman/Taskset.pm line 201.

A little google search and I found an example where the port was appended to the host. I then added the port 4730 to worker.pl and client.pl and it all worked as expected.

Once I got the simple example working, I added most of the agent.pl code to the worker.pl script, made a few small changes, and added comments. I was done!

The Gearman logging plugin sends query logs to the job server, and the job server asks the worker to do the actual job.
In the end, the service manager ends up with all the information related to the queries that go to the Drizzle server.

Layout.
For this initial version, one worker cannot handle jobs for more than one drizzle server, this is not a Gearman limitation. When I wrote this script, there was no way to tell the worker, which Drizzle server was sending the log entry.

And that was an excellent excuse to add a few more fields to the Gearman logging plugin. (That patch was already approved and will soon be part of the main Drizzle source.)


worker-1 handles requests for drizzled-1 and worker-2 handles jobs for drizzled-2. I am already looking into ways to change this.

Where is the code?
As usual, I posted the worker.pl script on the MySQL Forge.

How do I start the worker?
Like this:

$ DEBUG=1 perl worker.pl --serveruuid="22222222-5555-5555-5555-222222222211"\
--serverhostuuid="ssh:{11:11:11:11:11:11:11:11:11:11:11:11:11:11:11:21}" \
--serverdisplayname="Main-Drizzle-web2"


How do I start the client?
In this case, the Gearman client is the drizzle plug-in, so, all you need to do is add these lines to your drizzle.cnf

$ cat /etc/drizzle/drizzled.cnf
[drizzled]
logging_gearman_host = 127.0.0.1
logging_gearman_enable = true


Restart the Drizzle server and you are ready to go (well, you also need the MySQL Enterprise Monitor)

Final Note.
I was amazed at how easy it was to have it all working, I will keep looking for other projects where I could use Gearman.

Thursday, August 27, 2009

Drizzle query monitoring

Disclaimer:
This blog post is about things I did on my own free time, not endorsed by my employer.

A little over a month ago, Ronald posted a blog about the different query logging plug-ins that are available for Drizzle. This was pretty exciting news, especially when I saw the details that were included in the logs.

Meanwhile, a few weeks ago, I started looking at the REST API that comes with the MySQL Enterprise Monitor.

The result is that we can now see most of the information returned by the plug-in, on the Dashboard.


How?
A colleague at work, wrote a little Perl script that interacts with the REST API, and I took his work as the foundation for my agent.pl script.

The next problem was to find a way to call this script as soon as there was a new entry on the log. After a little Google search, I went ahead and decided to ask my friend Adriano Di Paulo (who among other things, introduced me to MySQL).
A few minutes later, he showed me a working example of the Tail Perl module.
That was exactly what I needed, as soon as there is a new entry, I call the function assemble_queries() and I pass the new log entry as the parameter.


sub tail_log {
my $file=File::Tail->new(name=>$log_file, maxinterval=>1, reset_tail=>0);
while( defined (my $line=$file->read ) ) {
print "\n" . $line . "\n" if $DEBUG > 3;
assemble_queries( $line );
}
}


The assemble_queries() function is mostly based on what MC blogged about some time ago. On his blog post, he shows how to collect query related data using Dtrace and Perl.

Then, every n number of queries, I use send_json_data() to send the query information to the Dashboard, delete the sent data and it is ready to process more queries.

Now that I'm writing this, I realized that if send_json_data() fails, the information related to the queries are lost :|. (Note to self, fix it).

There are other functions in there, but they are mostly for housekeeping.

How do I use it?
Very simple, get the agent.pl script from the MySQL Forge website, edit the credentials, hosts, and ports to fit your needs (Future versions would include some kind of config file).

And then you call the script like this:

$ DEBUG=1 perl agent.pl --serveruuid="22222222-5555-5555-5555-222222222211" \
--serverhostuuid="ssh:{11:11:11:11:11:11:11:11:11:11:11:11:11:11:11:21}"\
--serverdisplayname="Main-Drizzle-web2" \
--log-file=/path/to/log/file

As soon as the scripts starts, it will add the drizzle server to the service manager, and once you start sending queries to drizzle, those queries will end up on the UI.

Next?
Next is already done :). I modified the agent.pl script to use the gearman logging plugin. I'll write a blog about it very soon.

Thanks for reading and enjoy!


Monday, August 24, 2009

More Drizzle plug-ins

Last weekend, I finally got some time to look around Drizzle. I had already compiled it on my laptop, but hadn't really looked at the code.
Then, I thought that looking over some of the blueprints on Launchpad, would be a good way to get familiar with the code base.
After a quick search, I found move function/time/ functions into plugin(s)

This blueprint is basically to create UDF plug-ins for the different time related functions.
There was no priority assigned and it was on the low hanging fruit milestone. Which was perfect for someone who doesn't really know how much time he could spend, and wants to get to know the code.

The first step was to read a bit about the process to contribute to the Drizzle project, I went to the wiki here and read about the coding standards.

I then, went ahead and saw how difficult easy the code looked like. And proceeded to email the list, asking for feedback and also to tell others what I was up to. This is important, to avoid duplicating the work of others.

Code?
This is where the fun began. I had a fresh branch, and it was time to pick the first function to make into an UDF plugin.
By luck (and you will know why luck), I picked to move unix_timestamp() first.

The Process
There are already some great plugins on the Drizzle branch. I went ahead and duplicated the md5 plugin (in plugin/md5). Renamed the folder unix_timestamp, also renamed the md5.cc to unix_timestamp.cc and edited the plugin.ini file that was on the same folder.

The md5 plugin folder also has a plugin.ac file, but it turned out I didn't need this file, so I just removed it.

It was then time to do the actual code moving. To start, I opened drizzled/function/time/unix_timestamp.cc and drizzled/function/time/unix_timestamp.h
It was pretty much copy and paste from those two files into plugin/unix_timestamp/unix_timestamp.cc

And the rest was to replace md5 for unix_timestamp :)

Notes:
When I first started, I had both, the built-in unix_timestamp() and the plugin version. To make sure the plugin was returning the correct values, I just temporary named the plugin function unix_timestamp2(). And you can do that by just changing code in two lines:

Error messages
Whenever there is an error with your function, the error message will call the plugin function func_name(), the string you return there, will be shown on error messages. One way to force this error is by including either too many, or too few parameters.

const char *func_name() const
{
return "unix_timestamp2";
}

To tell Drizzle the name of your plugin function, you use this line:

Create_function unix_timestampudf(string("unix_timestamp2"));

Most (all?) plugins files will start with lib + <name of the plugin> + _plugin.la. You specify this name using this line:

drizzle_declare_plugin(unix_timestamp)
The rest should be pretty easy to figure out.

Tip
Which I wish I knew before. Something that took me way too long to find out, when you add a new plugin folder, you need to run ./config/autorun.sh and ./configure ... && make && make install. This would make sure your new plugin gets compiled., if you skip autorun.sh, your new plugin will not be compiled.

Final steps
Once I compiled the new plugin, and verified that it all worked well. It was time to delete the built-in function.
1) Went to drizzled/Makefile.am and removed function/time/unix_timestamp.h from there.
2) Removed the files drizzled/function/time/unix_timestamp.cc and drizzled/function/time/unix_timestamp.h
3) Edited drizzled/item/create.cc and removed #include and some other references to the unix_timestamp function.
4) drizzled/sql_parse.cc also had to be edited, to remove #include .
5) Added the new plugin/unix_timestamp/ folder and files to the bzr branch.
6) Run tests (and here I found a new problem)

I'm still working on a fix for it. I'm going with using one error message, for built-in functions, as well as plugins. I hope to be pushing those changes soon.

Oh, why was I lucky to pick the unix_timestamp() function as the first one to tackle, well, I have been working on timestamp_diff for many hours, and it just does not want to work. It somehow does not see the first parameter. I'm pretty sure I'll be asking the Drizzle-discuss for help :)

The end.


select * from information_schema.plugins where plugin_name like '%time%';
+-------------------------+----------------+---------------+---------------+--------------------------------+----------------+
| PLUGIN_NAME | PLUGIN_VERSION | PLUGIN_STATUS | PLUGIN_AUTHOR | PLUGIN_DESCRIPTION | PLUGIN_LICENSE |
+-------------------------+----------------+---------------+---------------+--------------------------------+----------------+
| unix_timestamp_function | 1.0 | ACTIVE | Diego Medina | UDF for getting unix_timestamp | GPL |
+-------------------------+----------------+---------------+---------------+--------------------------------+----------------+
1 row in set (0 sec)

drizzle>
Well, not really the end, I still have plenty of functions to move into plugins.

Thanks!

Monday, August 10, 2009

Vote for me! ... widget for your blog.

Most likely you have seen Giuseppe's post showing the latest feature of Planet MySQL. Voting from RSS readers, was one feature I was really hoping for, since the day voting was announced. As I read most blogs using Google Reader.

Now, I don't remember if it was Dups who asked me, or if I asked him, but all I remember is that I ended up writing a little JavaScript widget, that you can add to your blog. This widget allows readers to vote for your blog on Planet MySQL, all from within your blog.

Why would you want to add this JavaScript to your blog?
Because you want to make it very easy for your readers to vote if they like or dislike what they just read.

Requirements/Limitations.
Yes, there are a few (small?) things that have to be in place for this widget to work.
* Your readers will have to have an account on the MySQL.com website.
* But most important, your blog post has to be already on the Planet MySQL database.
* If you are using Feedburner, and the url on your feeds is not the same as your post's url, this does not work (which is my case :( ). But I'll look for a workaround.

Code.

All you need to do is add these lines of code to your template:


<script language="JavaScript"><!--
var planet = "http://planet.mysql.com/entry/vote/?apivote=1&";
var lk=encodeURIComponent(document.location);
var thumb_up="<img src=\"http://planet.mysql.com/images/thumbs_up_blue.jpg\" border=\"0\" />";
var thumb_down="<img src=\"http://planet.mysql.com/images/thumbs_down_blue.jpg\" border=\"0\" />";
document.write('Vote on the <br /><a href=\"http://planet.mysql.com/\" >Planet MySQL</a><br />');
document.write('<a title=\"Vote me Up on the Planet MySQL\" href=\"' + planet + 'vote=1&url=' + lk + '\">' + thumb_up + '</a>');
document.write('&nbsp;');
document.write('<a title=\"Vote me Down on the Planet MySQL\" href=\"' + planet + 'vote=-1&url=' + lk + '\">' + thumb_down + '</a>');
// --></script>


How do I add it to Blogger?

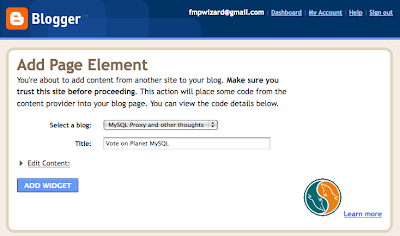
1- On the left side of this blog, you will see a "Add Voting to your blog" button, click on it.


2- On the "Add page element" section, select the blog you would like to add this widget to.
3- Click "Add widget"


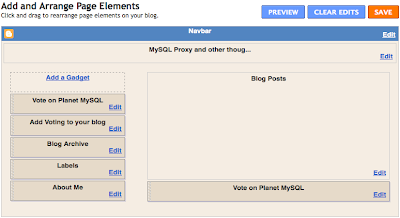
4- You will now see a widget under the name "Vote on Planet MySQL", you can go ahead and leave it there, or move it around.
This widget will appear on every single post you have.
5- Click on save, and you are done!


How do I add it to XYZ?

I'll talk to the Community team, and I'll ask them to have either a wiki page on the forge, or some place else the steps to add a widget like this to other blog platforms.

Enjoy!

Sunday, July 26, 2009

MockLoad on Launchpad - MySQL Proxy

Several months ago, I started a little project at work, called Mockload. It started as a fun way of using the MySQL Proxy, to test our monitoring agent, as well as the rules engine and graphs on the Service Manager.

Why?
I needed a tool that would be easy to use, and improve over time. And that it would allow our QA team to send custom values to the service manager. The goal was to pretend having some very busy MySQL servers.

And what better tool, than the MySQL Proxy itself to pretend being a busy MySQL Server!
The way our agent collects the MySQL related data, is by issuing different sql queries. So, I thought that I could have a MySQL proxy instance in between our agent, and the MySQL server we were monitoring.
This proxy would then intercept the queries that our agent was collecting, and it would return some custom values.

Writing Lua scripts
I started by looking at all the queries that our agent sends to the MySQL server it was monitoring, once I got the list, I went ahead, and looked at what values our graphs use. And finally I looked at the values our rules engine uses.

I then started by mocking just two queries, SHOW GLOBAL STATUS and SHOW GLOBAL VARIABLES.

What I do is I replace the values from a normal SHOW GLOBAL STATUS query, by Lua variables. And I manipulate those Lua variables to trigger alerts and to produce interesting graphs.

In the utils.lua script, I have this function


function increase_val(incoming_val, method, increaser)
if (method == "multiply") then
incoming_val = proxy.global.round( incoming_val * 1.1 , 0)
elseif (method == "add") then
incoming_val = incoming_val + increaser
end
return incoming_val
end
Pretty simple, this allows me to increase specific counters by just adding to the original value or by multiplying the original value by 1.1.

Replication.
But the fun does not stop there, with this script, I also mock a replication setup where the slaves show some serious replication lag.


This was actually pretty neat to implement, I had to make our agent go through the proxy to query the slave servers, so that the master and the slave would report the same binlog names, etc.

Oh, and for the most part, the proxy reports having 700 binlogs, 700 users without password, 700 users with root access to the server. These are all values that are supposed to put stress on our monitoring system.

The other challenge I had with simulating replication was how to tell each proxy instance, that the backend was a master or a slave server.
My first idea was to have two different Lua scripts, but that just did not look clean, I then thought of sending a custom query through each proxy, to tell it what the backend was. But again, I wasn't happy with neither approach. So I finally decided to do some query injection.

Master or Slave?
Whenever our agent sends a query SHOW MASTER STATUS, the lua script injects a SHOW SLAVE STATUS query to the queue. If the proxy finds an empty resultset for the slave status, it assumes that the backend server is a master. While this is not a foolproof method, it works fairly well for now.

You can see the replication mocking on the mockload.lua file.

Graphs?
These are just some of the graph our service manager produces when we use MockLoad:


Controlling the counters.
To prevent the counters from increasing without limit, I use a global variable that sets the maximum value any counter could get. Once any counter reaches that value, all counters are reset to their initial values.

Source code?
You can find the scripts that make up MockLoad on Launchpad. You may ask why I'm hosting them there. The answer is that I still have a long way to go with MockLoad, and I thought that some people would benefit from seeing how this was implemented. Who knows, someone may be able to use it as is, or without many changes.

How do I use it?
You need at least one MySQL server and a Proxy. You tell the proxy where the lua modules are by doing this:

Assuming the main file is
/usr/local/scripts/mockload.lua
and the modules are in

/usr/local/scripts/mockload/

$ export LUA_PATH=/usr/local/scripts/?.lua
$ ./sbin/mysql-proxy --defaults-file=/path/to/ini/file/proxy.ini

You can then send a query like SHOW GLOBAL STATUS through the proxy port 4040, and each time you send that query, you will notice some counters returning increased values (more than normal for an idle server :) )

I hope you all enjoy it and as always, feedback is welcome.

Wednesday, May 27, 2009

MySQL Proxy => proxydb + replication

A couple of weeks ago I wrote a lua script to use with the MySQL Proxy that transforms the Proxy into a key=>value lookup dictionary.

But I couldn't just stop there. So I decided to add replication to it :).


The basic idea is that you have one proxy that acts like a master, it can handle all write/read operations. Once it receives a write query, it will send that query to the slave proxy instances, and after the last slave gets the query, the master will return a confirmation to the mysql client.
And of course, you send your read queries to the slave proxy instances.

Show me the code.
It is available on the MySQL Forge. And I'd recommend using Oldag's version of the sandbox, which allows you to easily setup different topologies of MySQL servers and Proxies. (It saved me lots of time)

Complex situation, lots of ins, outs and what have you.
(or how does it work?)

It uses the connection pool feature from the MySQL Proxy that is based on the rw-splitting.lua script.
This means that you will need to start a few different connections to the master proxy instance to get the poll going.
I do this by using this simple command line

$ for i in `seq 1 100` ; do ./proxy1/use -e "exit"; done ;
It also makes usage of mocking a mysql server. The script checks if there is a backend defined (proxy-backend-addresses), if there is one, it will tr to open a connection, otherwise, it is the last node on the chain and it will return an OK packet.

Oh, look at the proto.to_challenge_packet({}) function, which is better than working directly with the protocol.

We then have read_query(), which is pretty easy to understand, I tried to add as many comments as I could to the actual code.
We have different functions for each type of query. I think this is a clean way of doing :).
You will also see that each function that handles different query types has a line like this one:

if proxy.global.last_node == 0 then

This tells the proxy that if it is the last node on the chain, it has to return a resultset

read_query_result()
This was fun to work on. Here is where you send the queries to the slave proxies. The proxy loops over the list of backends and appends the same query. Once it reached the last proxy, it resets the current backend server and returns an OK packet to the mysql client.

This implementation could help you duplicate and reroute your queries to a different mysql server. So that you can send them to a server with different values on the my.cnf file, or any other changes that you'd like to test.

I hope you find it useful and feedback is always welcome.

*I got seq for my mac from this post.

Vote on Planet MySQL